Industry data provided by production surveys can serve as a benchmark for production performance across the country. Historical production surveys include the Alberta Cow-Calf Audit (1986-88, 1997-98) and “Reproductive Efficiency and Calf survival in Ontario Beef Cow-calf Herds” (1983). Sixteen years later, the survey was revived, revised and expanded into the Western Canadian Cow-Calf Survey (WCCCS, 2014). Between 2013 and 2017 Cow-Calf Production Surveys were conducted in Western Canada, Ontario, Quebec and Atlantic Canada. These surveys provided a benchmark of production performance and management practices on beef cow-calf operations in each region and informed the 2019 Adoption Rates Report. Most recently, the Beef Cattle Research Council (BCRC), Canfax Research Services and regional representatives collaborated to generate national statistic through the inaugural 2022-2023 Canadian Cow-Calf Survey (CCCS).
Historical Cow-Calf Surveys
| Survey Name | Production Year | Responses | Publication Year |
|---|---|---|---|
| Canadian Cow-Calf Survey (CCCS) | 2022-23 | 600 | 2024 |
| Atlantic Cow-Calf Survey (ACC) | 2016-17 | 65 | 2018 |
| Ontario Cow-Calf Production Survey (OCC) | 2015-16 | 83 | 2018 |
| Northern Beef Study (Ontario and Quebec) | 2015-16 | 99 | Lamothre, 2018 |
| Reproductive Efficiency and Calf Survival in Ontario Beef Cow-Calf Herds | 1983 | 225 | Rogers et al., 1985 |
| Western Canadian Cow-Calf Survey (WCCS II) | 2016-17 | 261 | 2018 |
| Western Canadian Cow-Calf Survey (WCCS) | 2013-14 | 411 | 2015 |
| Alberta Cow-Calf Audit | 1997-98 1986-87 |
1,974 | 1999 |
| Beef Cattle Management in Manitoba | 1997 | 507 | Small and McCaughey, 1999 |
The objectives of the above highlighted cow-calf surveys were multifaceted:
First, to establish industry benchmarks for production indicators and management practices. Herd productivity is closely linked to herd profitability. The break-even price for calves can be lowered by decreasing total cow herd costs or by increasing the total pounds of calves weaned. Increasing the total weight (lbs) of weaned calves can be achieved by improving herd productivity, such as:
a) INCREASING – conception rates, weaning rate, etc.
b) DECREASING – calf death loss, calving span, etc.
While it is good management to track and calculate herd production performance indicators on an annual basis, it can be helpful to have benchmarks to compare to. Benchmarks help a producer know if they are on the right track for their region and the environment they operate in. They can help a producer identify if they excel in one certain area and/or could improve in another. Benchmarks can also help to show what production and management practices other producers are following.
Second, to establish industry trends. The longer history of cow-calf surveys in Alberta shows how producer adoption for different practices has changed (or didn’t change) over time. Regional expansion plans in the Maritimes and Northern Ontario and Quebec have spurred an interest in monitoring trends in those areas as they focus on improving profitability and growing inventories.
Third, to guide research and extension efforts. Information around death loss rates and causes can inform research efforts into specific diseases. It can also highlight areas where extension and communication about existing tools and information to producers, based on research that has already been done, could benefit cow-calf operations.
The 2022-2023 Canadian Cow-Calf Survey (CCCS)
The 2022-2023 Canadian Cow Calf Survey was distributed to producers from November 2023 through to March 31, 2024. The survey collected data from 600 producers across nine provinces on the 2022 breeding season through the 2023 weaned calf crop, as well as reasoning and rationale for some practices.
Data for Quebec and the Maritimes were grouped together for a larger sample size; this will be labelled as “QC&M” in the following graphs.
Highlights
When reading the results, it should be remembered that differences between regions does not necessarily mean that producers need to switch to a new practice because environmental conditions and production systems influence whether a practice makes sense in one situation and not in another. In addition, there were differences between how the questions were asked and therefore results are not always comparable between surveys, not only between regions, but within regions historically.
Preg-Checking
Pregnancy detection is a recommended practice that allows producers to make management decisions (e.g. utilization of winter feed) and marketing decisions based on the reproductive status of their herd.
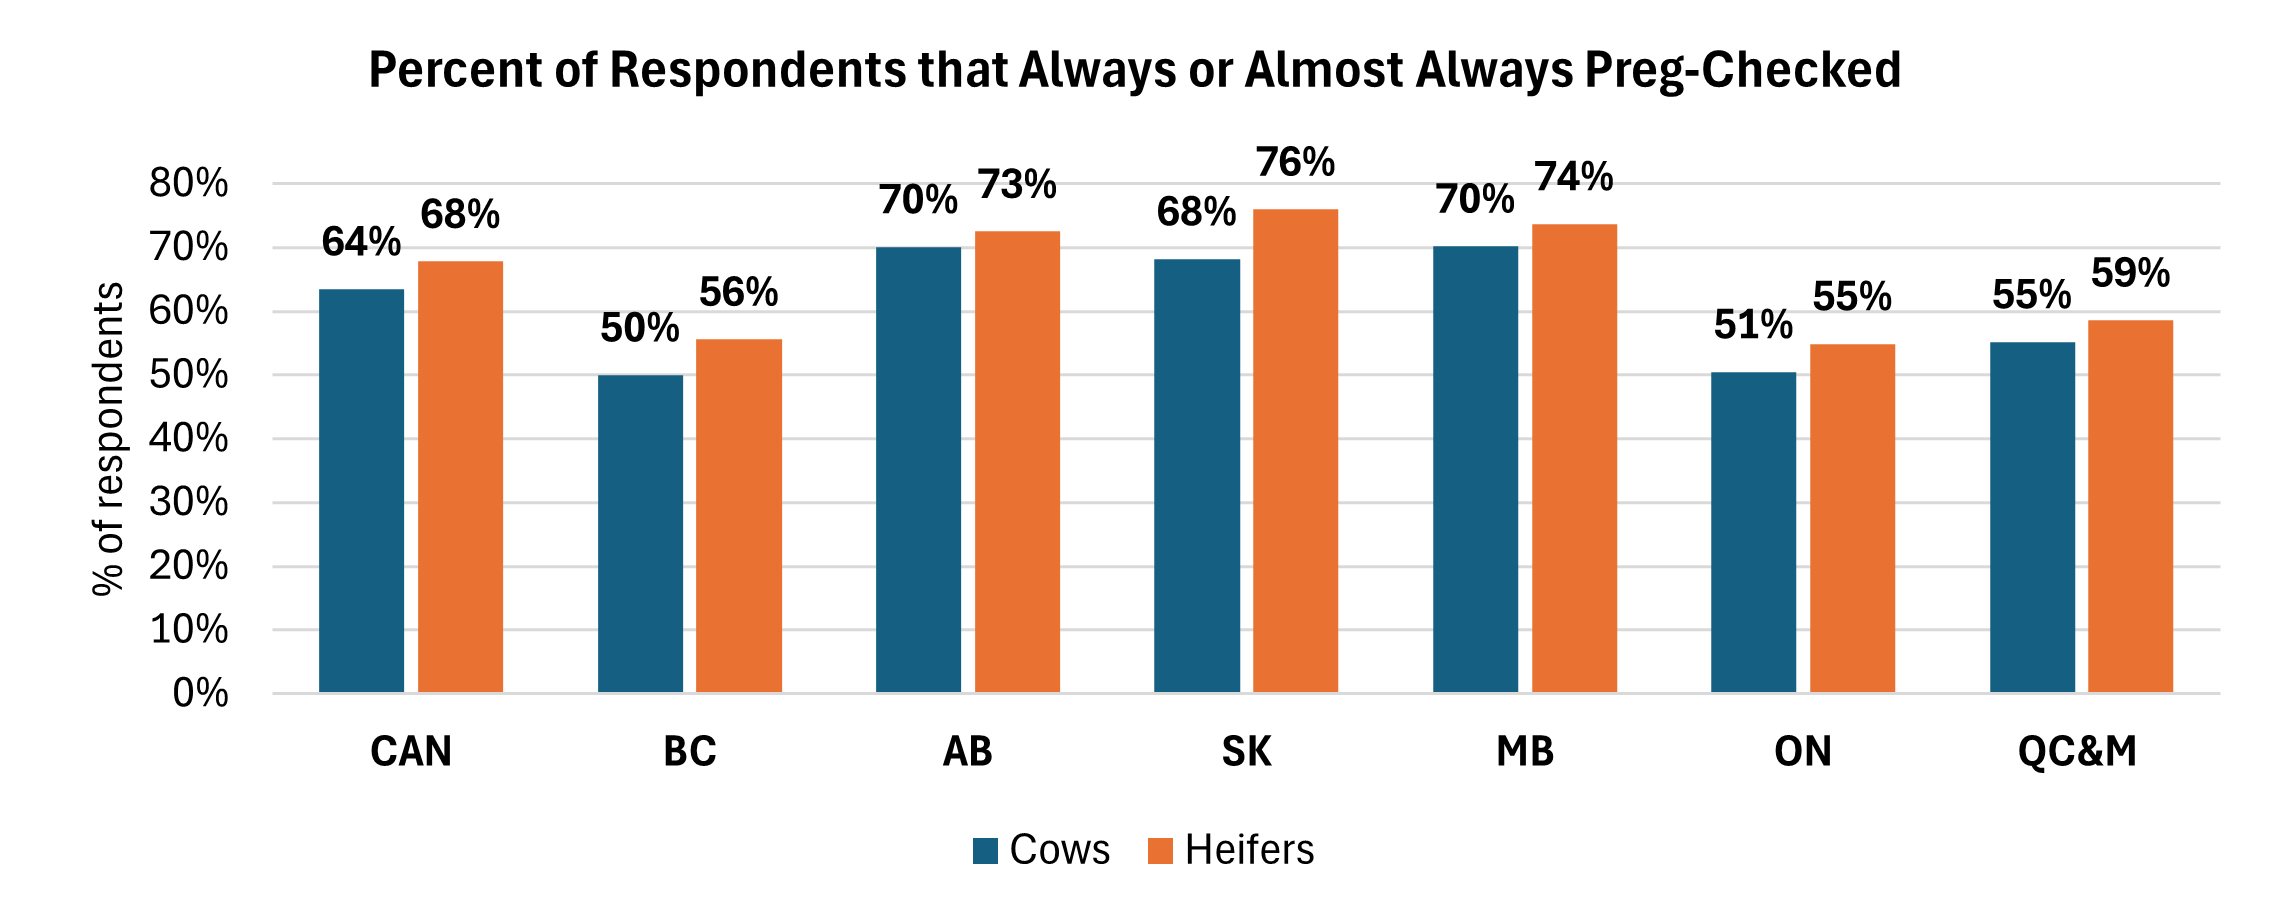
Over the past thirty years, it appears that there has been an upward trend in producers adopting pregnancy checking. In 1997/98 the Alberta cow-calf audit reported that 49% of producers preg-checked their herd. This increased to 62% always checking cows and 71% checking heifers in 2017 (WCCCS II), and again 70% preg checking cows and 73% checking heifers in 2022-2023 (CCCS). Rogers et al. (1985) reported that 12% of Ontario producers preg-checked in 1983 and this increased to 66% of producers preg-checking cows and 64% checking heifers in 2015/16. Most recently, the 2022-2023 CCCS reported that 68% of respondents always or almost always pregnancy checked most of the time, while 67.8% do so for their heifers.
There remains an opportunity for even greater uptake, with existing data demonstrating that approximately one-third of producers in western Canada and half of the producers in Atlantic Canada have yet to regularly adopt this practice on their farms.
Of the respondents that reported not pregnancy checking cows, 32.9% cited the reason as the ability to identify open females and 26.2% cited the strategy of selling open cows after calving when cull prices are higher. The remaining factors contributing to the decision-making process included cost inefficiency (13.3%), prioritizing different farming activities (7.1%), lack of facilities (5.8%) and shortage of labour (5,3%). The lack of access to a veterinarian was cited by 2.2% of respondents.
Reproduction
Research recommends exposing cows to breeding for 63 days or less and for heifers to be bred at least 14 days earlier than cows given their longer postpartum interval (80-100 days for heifers versus 50-60 days for cows). About one-third (32.3%) of respondents have a 63-day breeding season for cows. This percentage was slightly higher for heifers at 38.4%.
Nationally, the average cow open rate was 7.4%, while the heifer open rate was 11% in the 2022 breeding season. The lowest open rates were reported in Quebec and the Maritimes with 4.1% in cows and 8.1% in heifers. The highest open rates were reported in Manitoba with 10.1% in cows and 13.2% in heifers.
Nationally, the average calving season length was 89 days for cows and 59 days for heifers. Recommended calving span is 60 to 80 days for efficient use of labour, a more uniform calf crop, and improved productive and reproductive efficiency.
Calf Death Loss
Nationally, calf death loss within 24 hours of birth averaged 2.2% for cows and 3.7% for heifers in the 2023 calving season. For comparison, the reported losses in Ontario in 2016 was 3.0% for cows and 4.1% for heifers, and Western Canada in 2017 reported 2.7% in cows and 4.4% in heifers.
Death loss between 24 hours and weaning averaged 2.5% for calves born to cows and 2.9% for calves born to heifers across Canada. For comparison, the reported losses in Ontario in 2016 was 5.3% for cows and 3.4% for heifers, and in 2017 Western Canada reported 2.5% in cows and 2.4% in heifers.
Pain Mitigation for Dehorning
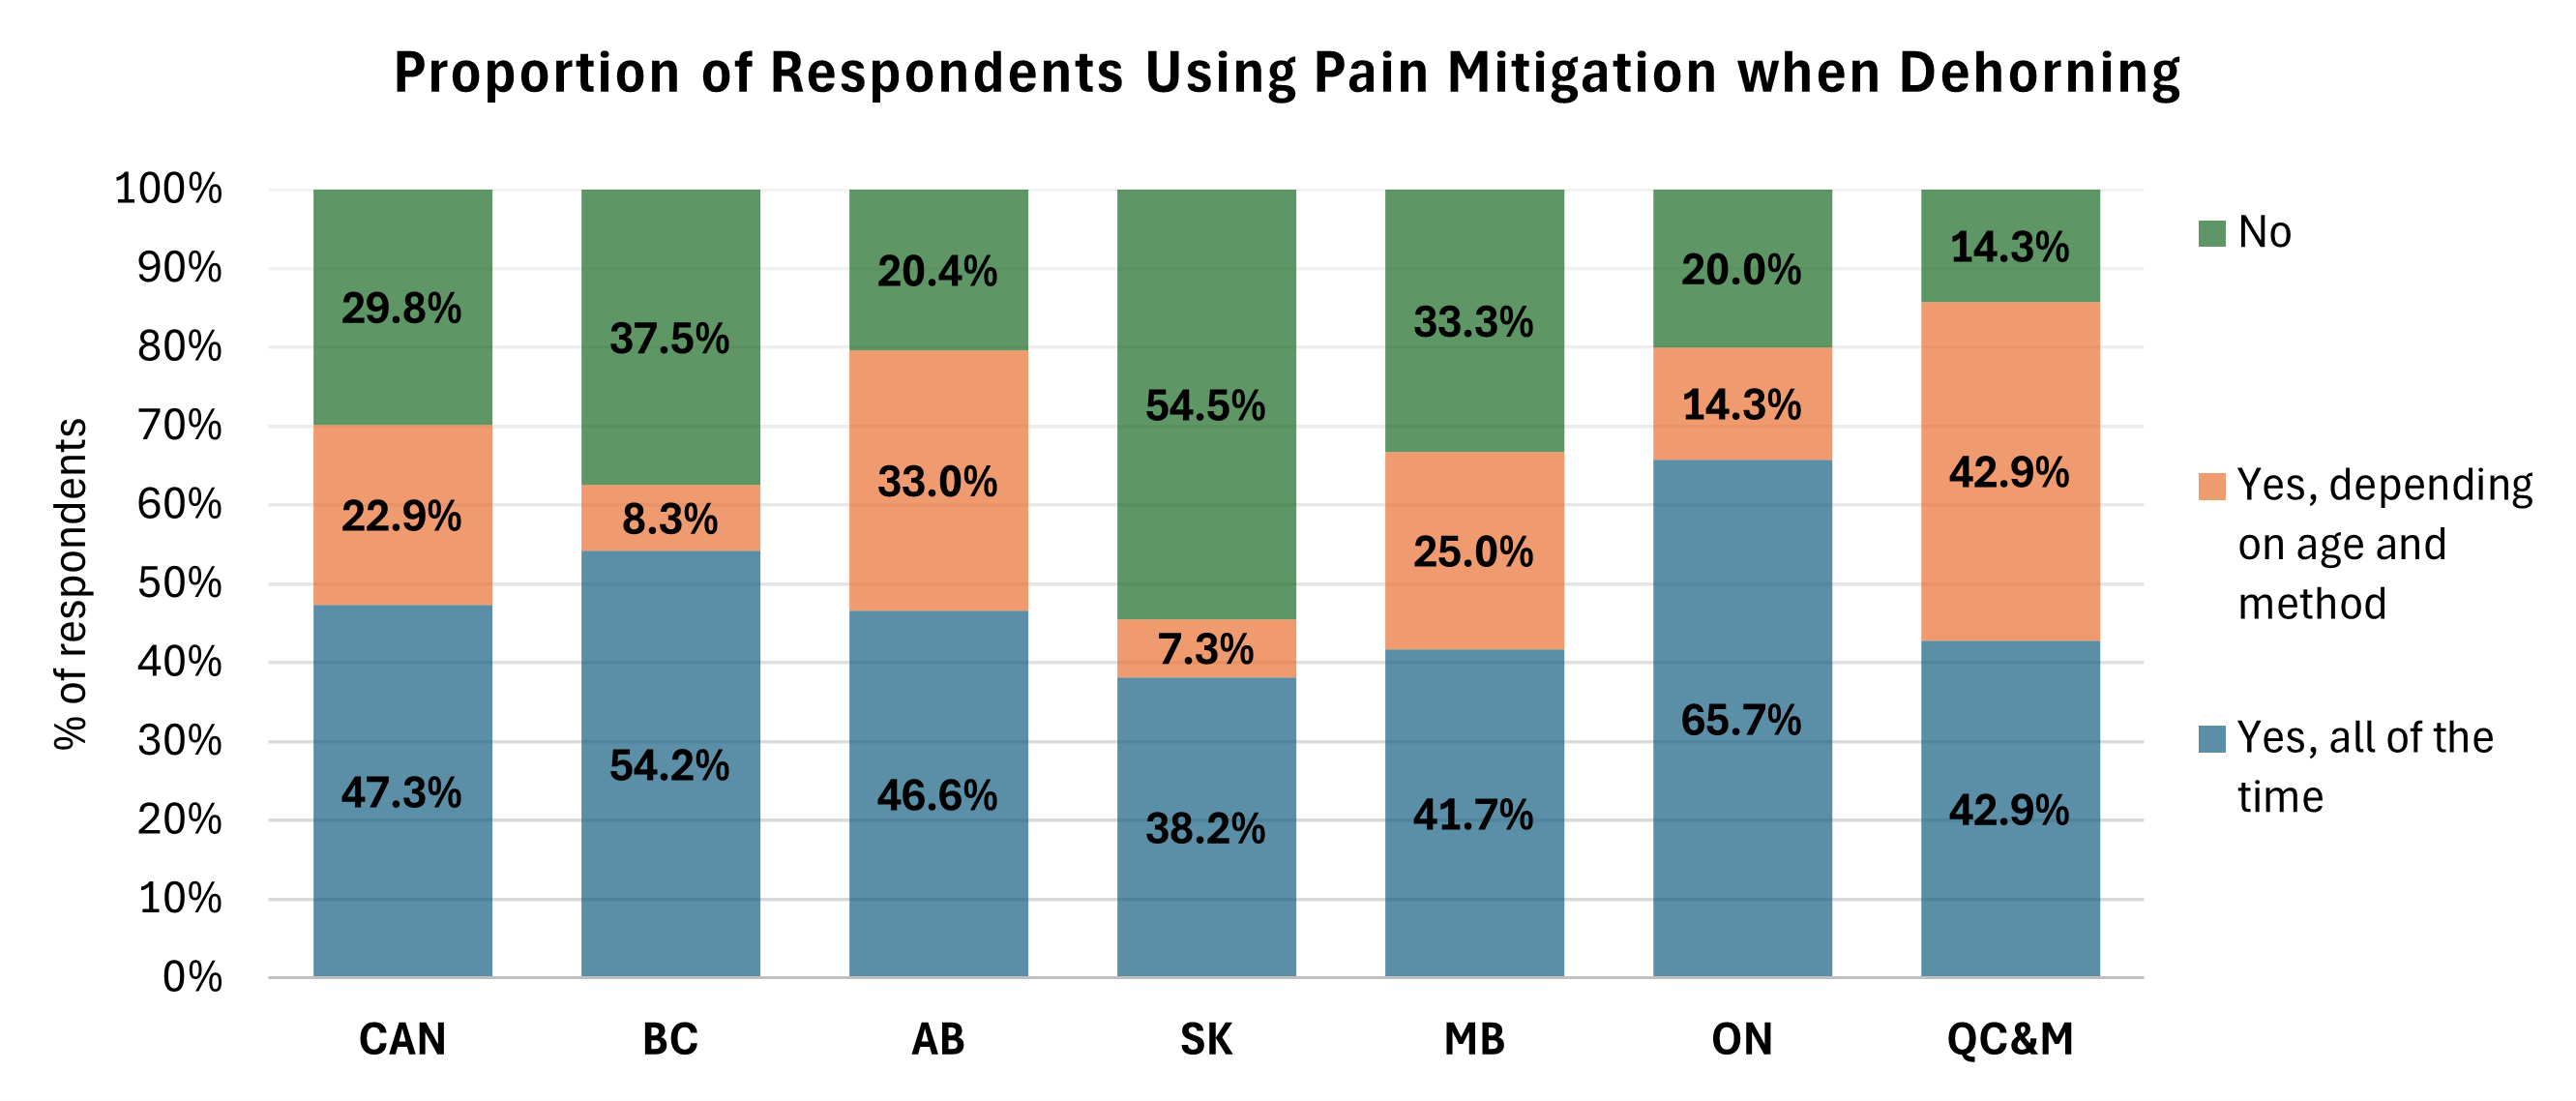
Recent advances in pain mitigation have provided producers with opportunities to use products that were unavailable in the past. Using pain mitigation, such as NSAIDs, and/or anesthetics, during painful procedures is a recommended practice. Uptake of pain mitigation has increased in western Canada from 9% as reported in WCCCS in 2014 to 45% in 2017. According to the 2022-2023 CCCS, across Canada, the proportion of respondents using pain mitigation when dehorning was 47.3%.
For those using main mitigation, the type of pain control varied, with 78.6% using anti-inflammatory only, 15.9% using local anesthetic plus anti-inflammatory, and 4.4% using local anesthetic or nerve block only. There is an opportunity for extension efforts to target the remaining producers across regions who are dehorning calves without using pain medication.
Implanting
Hormone implants promote faster and more efficient growth, through increased average daily gain and improve feed efficiency, thereby reducing the environmental footprint by decreasing the amount of feed required over the animal’s lifetime and lowering the greenhouse gas emissions per kilogram of beef produced. (BCRC, Beef Quality Audits, 2024). Nationally, 24.7% of respondents implanted their 2023 calves. The practice varies regionally, with 5.5% in Ontario to 38.8% in Saskatchewan.
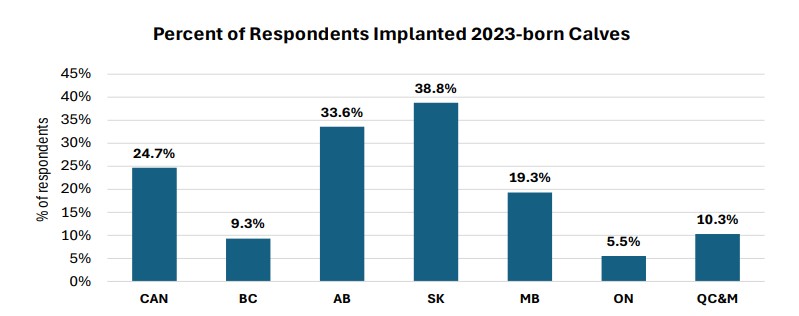
Interestingly, of CCCS respondents, for those who do not implant, the top reason, selected by 22.6% of respondents, was a philosophical opposition to using implants. Finding it too expensive or seeing no financial benefit followed at 18.1%. The “Other” category accounts for 17.7% of responses. These reasons include the lack of knowledge or interest in implants, buyer preferences for non-implanted calves, operational constraints like small herd sizes or EU certification, lack of observed benefits or disbelief in the effectiveness of implants, and breeding considerations such as not implanting purebred calves or those retained for breeding purposes.
Pain Mitigation for Castration
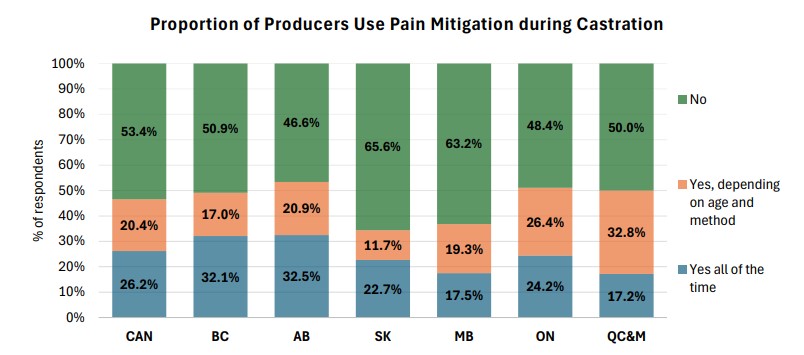
The 2022-2023 CCCS found that pain mitigation during castration was always used by 26.2% of respondents, while 20.4% use it depending on age and method. 53.4% of respondents do not use pain mitigation during castration with the primary reason (87% of respondents) being that calves are castrated before three months old. For comparison, in 2017, 72% of producers in Western Canada did not use pain mitigation during castration with the same primary reason.
Weaning
Low-stress weaning is becoming more common (2022-2023 CCCS) in Eastern Canada (55 to 58% of producers, depending on the region, compared to 33 to 46% in the 2017 Atlantic and Ontario Cow-Calf Surveys). Low-stress weaning changed less in Western Canada (44 to 54% of producers in 2023-24, depending on the province, compared to 51% in the 2017 WCCCS II). Time, labor, facilities, logistics, convenience and lack of economic incentive are the major barriers to adopting low-stress weaning.

Vaccination and Parasite Control
Vaccinating breeding females for reproductive disease and vaccinating calves for respiratory disease are recommended practices. Vaccination requirements vary by region and by farm as production and management practices can increase or decrease the amount of risk cattle are exposed to.
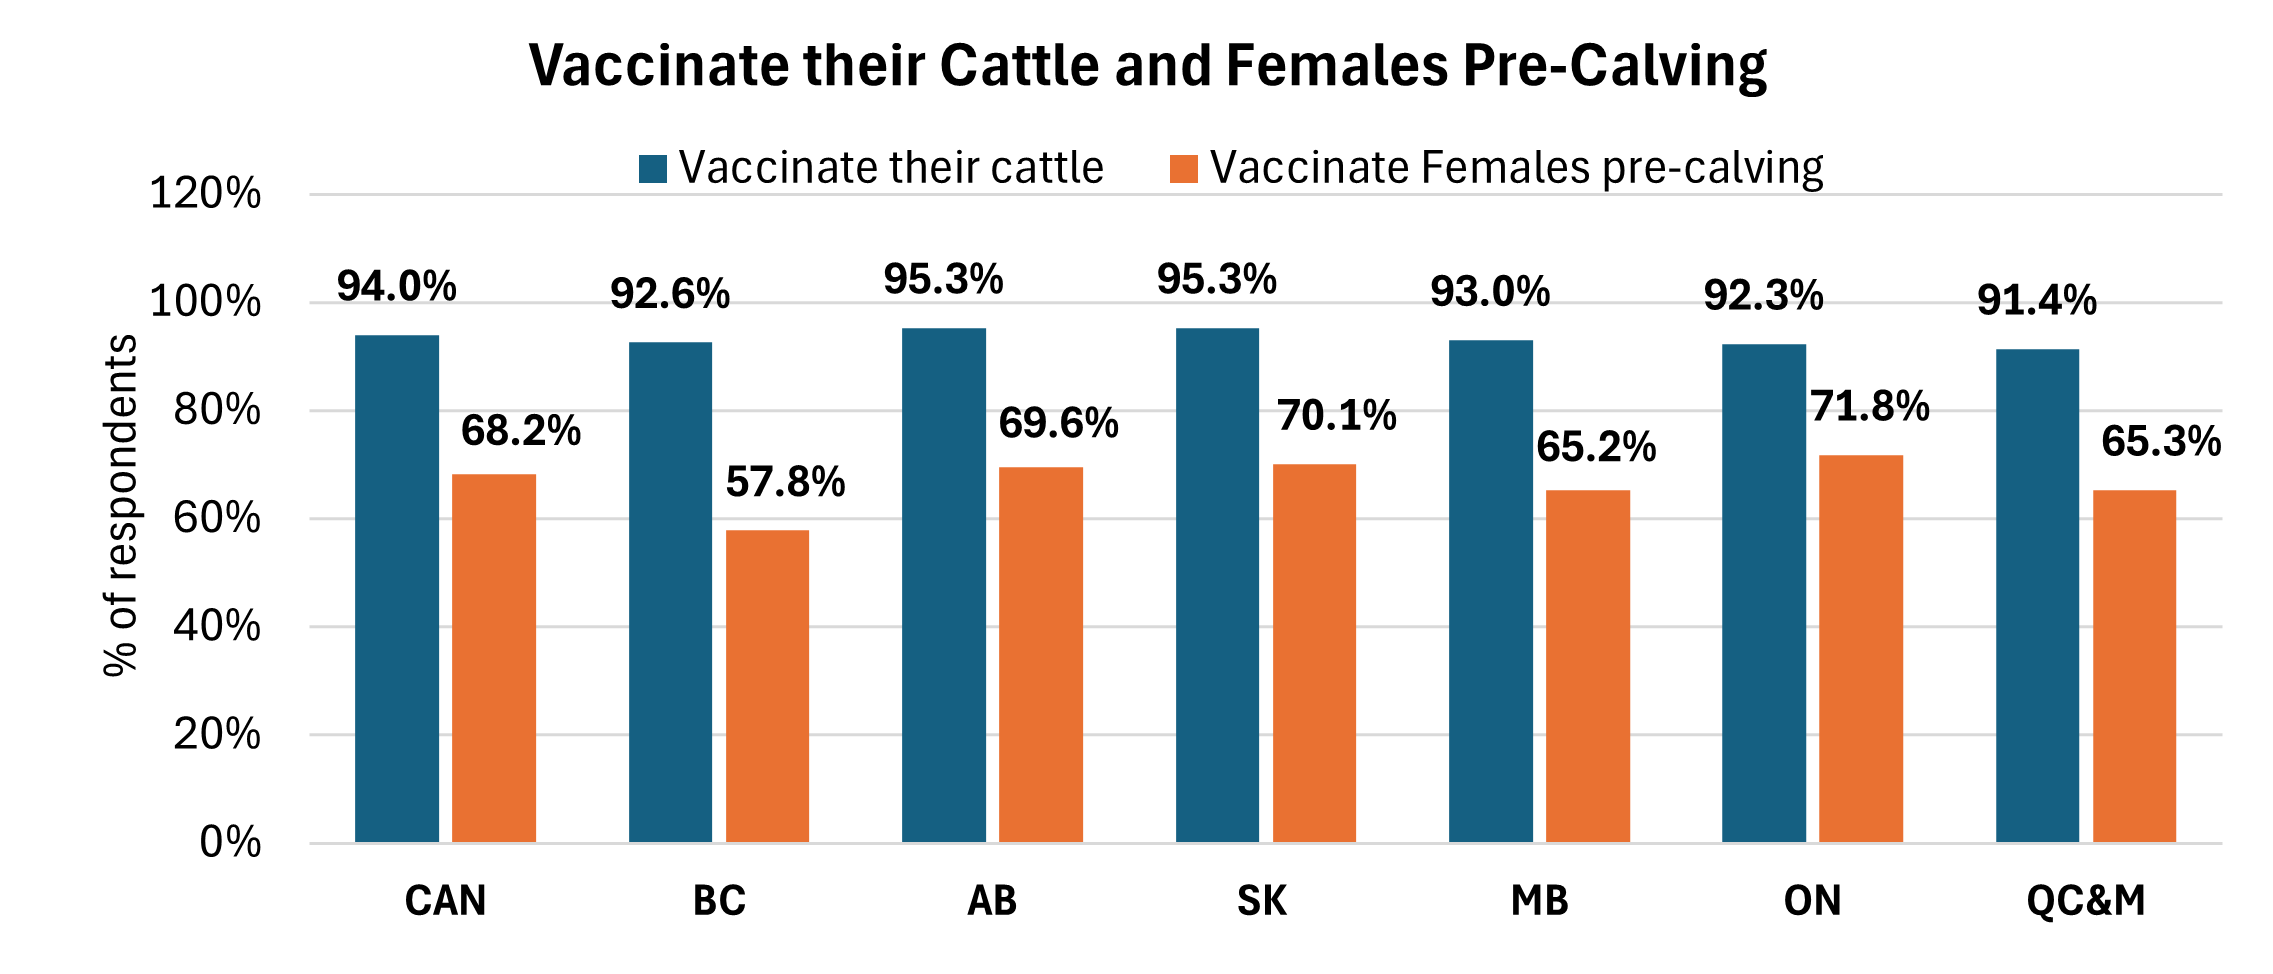
Managing for external parasites is relatively stable across Canada (84.6-94.4%). Internal parasites management is lower (17.2-33.3%) than external parasite management in most regions.
Marketing
More than 60% of respondents (2022-2023 CCCS) sold calves at weaning, while 40% indicated that they have retained ownership of most of their calves after weaning in the last three years.
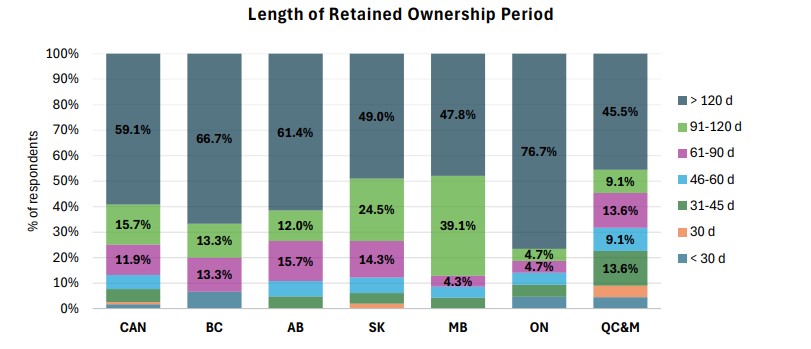
The leading motivations for retaining ownership were to sell in a different time period (54.4%), secure a higher price (48.9%), improve calf health (28.5%) and meeting buyer requirements (22.6%).
Feed Testing
Results from the 2022-2023 CCCS showed that, on average, 69% of Canadian cow-calf producers lab test their feed occasionally or annually. For comparison, 60% of Western Canadian producers in 2017 and 34% of Ontario cow-calf producers in 2016 reported lab testing their feed occasionally or annually.
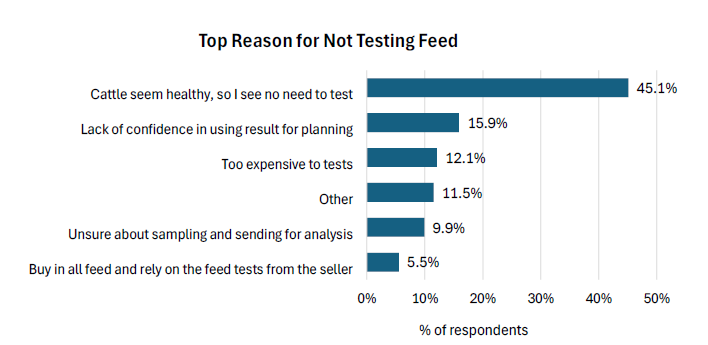
Approximately 31% do not feed test. The majority (45.1%) cited the perception that their cattle appeared healthy, thus no need for testing. Other significant reasons included the lack of confidence in making or implementing plans based on feed test results (15.9%), the perceived high cost of testing (12.1%) and uncertainty about how to collect and send feed samples for analysis (9.9%).
Water Testing
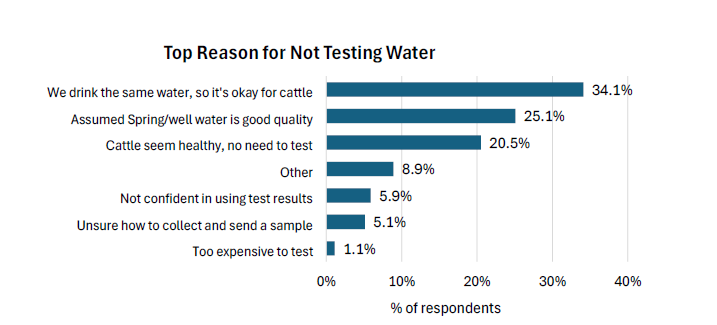
According to results from the 2022-2023 CCCS, 38.2% of respondents tested their livestock’s drinking water one or more times in the past three years. Of those who never tested livestock’s drinking water, 20.5% of respondents see no need to test as their cattle appear healthy, 5.9% lack confidence in using test results and 5.1% are uncertain about sample collection and submission (5.1%).
Remote Drug Delivery
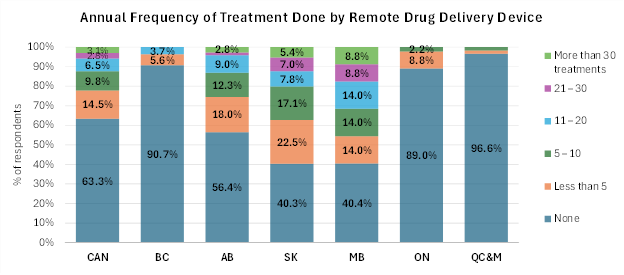
Results from the 2022-2023 CCCS showed 63.3% of respondents did not use a remote drug delivery device (RDDD) for treatment, while 14.5% used it fewer than five times a year, 9.8% used it five to ten times a year, and 6.5% used it 11 to 20 times a year. The adoption rate of remote drug delivery devices was higher in the prairie provinces, compared to the rest of the country.
Body Condition Score
In Western Canada, 69 to 82% of producers reported visually evaluating BCS (2022-2023 CCCS), up from 64% in 2017 (WCCS II). Adoption increased markedly in Central and Eastern Canada (67 to 71% of producers, up from 23 to 50% in 2017). Hands-on BCS scoring remained much lower in both Western (5 to 19% of producers, vs. 13% in 2017) and Eastern Canada (13 to 21% vs. 0 to 26% in 2017).
- Western Canadian Cow-Calf Survey (WCCS II) 2016/17
-
Western Canadian Cow-Calf Survey (WCCCS II) 2016/17

The second Western Canadian Cow-Calf Survey (WCCCS II) was distributed to producers from November 2017 until the end of February 2018. A total of 261 survey responses were received (representing 34,500 cows). Response rates varied by province with the greatest percentage of respondents being from Alberta (41%), followed by Saskatchewan (27%), Manitoba (25%) and British Columbia (7%). The average age of survey respondents was 50 with an average of 27 years in the cattle business.
Calving and Reproduction
Survey respondents provided details on their 2017 calf crop starting with the 2016 breeding season and ending with weaning. Cow:bull ratio averaged 21:1 and breeding season length averaged 91 days, steady with the 2014 WCCCS. A breeding season no longer than 63 days is recommended to maintain a 365 day calving interval and improve calf crop uniformity, but only 20% of respondents achieved this recommended target, down from 25% in 2014.
Breeding heifers 4 to 6 weeks before the cows is recommended so that heifers have more time to recoup (i.e. longer post partum interval) after their first calf is born. Only 14% of survey respondents bred their heifers 14 days before the rest of the herd, down from 26% in 2014.
The average open rate was 8% in cows and 12% in heifers. The conception rate for all females was 92% compared to 92.8% in 2014 and 95.6% in AB in 1998.
Weaning
The most common weaning method remains traditional separation (49% down from 70% in 2014), with others using low-stress fenceline (35% up from 22% in 2014), two-stage/nose paddle (12% up from 6% in 2014) or natural (3% steady with 2014). The calf crop (calves weaned per female exposed) was 85%, with 533 lbs weaned per female exposed, steady with 2014 and 28 lbs higher than in 1998.
Marketing
About 68% of respondents sold a portion of their calves at weaning, with 22% preconditioning (up from 9% in 2014) and 45% retain ownership and sell as yearlings or fed cattle. Some producers used multiple calf marketing strategies. Most respondents (59%) marketed calves via live auction, 20% sold calves direct/private treaty, 11% used electronic auction and 5% used an order buyer.
Implants
Only 26.5% of survey respondents implanted their 2017 calves, up slightly from 24% in 2014.
Dehorning
The majority (89%) of respondents report having more than 75% polled calves. About 31% of respondents always use some form of pain mitigation when dehorning, while 14% use it occasionally. Pain killers (analgesics) were used the majority of time (86%), while 9% used a combination of local anesthetic and pain killers.
Castration
The majority (93.5%) of respondents castrate calves before 3 months of age. An increasing number used pain mitigation when castrating with 13% always using pain control measures and 15% will use pain control depending on age and method. That is a notable increase over the 4.2% of respondents in the 2014 WCCCS. Some of the 2017 respondents said although they didn’t use it that year, they were planning to include pain control in future calf treatment protocols.
Other Practices
About 77% of producers performed some type of body condition scoring: 13% performed hands-on BCS scoring, while 64% used a visual method. 77% vaccinate calves for respiratory diseases, and 65% vaccinate cows and heifers for reproductive diseases. Over 62% lab test their winter feed for quality at least occasionally (up from 47% in 2014), and 95% of those use the results to balance rations.
For more information:
Alberta Cow-Calf Audit 1997/98 http://westernbeef.org/pdfs/economics/AB_CowCalf_Audit.pdf
Western Canadian Cow-Calf Survey 2014 http://westernbeef.org/pdfs/economics/WCCCS_Summary_Overall_Jun2015.pdf
Western Canadian Cow-Calf Survey 2017 http://westernbeef.org/pdfs/wcccs/2017_WCCCS_Summary-FINAL.pdf
- Ontario Cow-Calf Survey 2015/16
-
Ontario Cow-Calf Survey (OCCS) 2015/16

The 2015/16 Ontario Cow-Calf Survey, the first since 1983, was distributed to producers from April 2017 to November 2017. A total of 83 survey responses were received (representing 4,300 cows).
Survey respondents provided details on their 2016 calf crop starting with the 2015 breeding season and ending with weaning. Cow:bull ratio averaged 24:1 and breeding season length averaged 118 days for cows and 107 days for heifers. A breeding season no longer than 63 days is recommended to maintain a 365 day calving interval and improve calf crop uniformity.
Calving and Reproduction
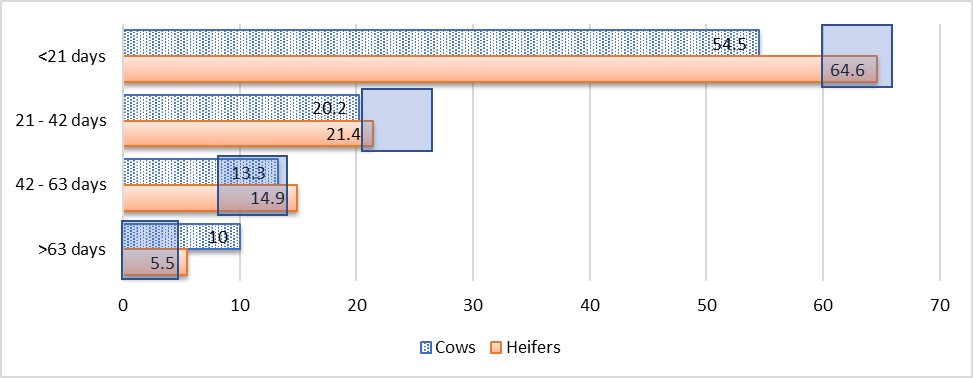
The target is to have 60%+ of females calving in the first 21 days of the calving, 20-25% in the second 21 days and the remaining in the third 21 days. The survey showed on average 5-10% of all females calved after 63 days or 3 cycles. The rectangles shown in the graph below indicate the suggested range for the percentage of females calving within each 21-day time frame. For example, in the first 21 days (top line) it is recommended that 60-65% of cows and heifers will calve. The heifer line is meeting the target; however the cow line has some room to improve.
Percentage of Females Calving in Each 21 Day Period (Median Percentage)
The average open rate was 9% in cows and 14.5% in heifers. The average conception rate was 89% on cows and 87% on heifers. About 26% of producers regularly body condition score.
Pregnancy checking is used by 66% on cows and 64% on heifers. Bull soundness evaluations were used by 17% of respondents. Bull selection is based on breed, conformation, pedigree and birth weight.
When it came to calving ease, producers reported that 17% of heifers needed some assistance, while only 4% of cows needed assistance. The C-section rate was very low for both groups — 0.1% for cows and 0.4% for heifers. The average abortion rate across farms was 1.0% for cows and 0.6% for heifers. The average birth weight was 84.5 lbs with 28% using a scale, 13% using a weight tape, 16% estimating and 43% not reporting.
Calf death
The average calf death loss for both cows and heifers was reported at about 8% (8.2% for cows and 7.5% for heifers). The percentage of calves born dead or that died within the first 24 hours was 3% for cows and 4.1% for heifers. The calves that died from birth to weaning was 5.3% for cows and 3.4% for heifers.
There were four main causes of death – scours, respiratory disease, predators, and unknown causes. Scours was significantly higher for heifers at 52%; but was also the main cause of death for calves born to cows (31%). Early life interventions included selenium (71%), weighing (57%), and vitamins (55%).
Weaning
The most common weaning method remains traditional separation (54%), with others using fence line (22%), two-stage/nose paddle (15%) or natural (5%) weaning.
Marketing
Most respondents (65%) marketed calves via live auction, 15% sold direct to feedlot, and 4% used an order buyer. Creep feeding, the practice of supplementing the dam’s milk with feed provided in pasture, appears to be a regular practice for the responding operations with two-thirds (66%) of participating operations using this practice.
Dehorning
The majority (86%) of respondents report having more than 75% polled calves. About 36% of respondents always use some form of pain mitigation when dehorning, while 15% use it based on age and method. Some 35% who do use pain control methods use a local anaesthetic only, 41% use a local as well as a pain killer such as meloxicam, 17% use only a pain killer and 7% use other pain control methods.
Castration
The majority (53%) of respondents castrate calves shortly after birth, 11% at spring processing, 25% at weaning, and 11% at other times with 26% saying they use pain control.
Other Practices
The majority (88%) reported they do vaccinate cattle for different diseases. Among those who do vaccinate, 52.5% reported that they provide vaccination of females prior to breeding. Over 34% lab test their winter feed for quality at least occasionally, and 79% of those use the results to balance rations. Over half (54%) provide water pumped to a trough and 30% had tested water quality within the past five years.
For more Information:
Rogers, R.W., Martin, S.W., and Meek, A.H, 1985. Reproductive Efficiency and Calf Survival in Ontario Beef Cow-Calf Herds: A Cross-sectional Mail Survey. Can. J. Comp. Med. 49, 27-33.https://www.ncbi.nlm.nih.gov/pmc/articles/PMC1236112/pdf/compmed00001-0029.pdf
- Northern Quebec Cow-Calf Survey 2015/16
-
Northern Quebec Cow-Calf Survey 2015/16
The first ever Northern Quebec Cow-Calf Survey had a total of 99 responses representing 12,607 females with an average herd size of 137 females (cows and heifers). Survey respondents provided details on their 2016 calf crop starting with the 2015 breeding season and ending with weaning. The majority of herds were commercial (88%) while purebred (12%) herds were also represented. Over half (52%) of respondents were single owner-operators with the rest having a second (40%) owner-operator or more. The average age of respondents was 54 years old, with an average of 24 years of experience in beef production.
Calving and Reproduction
Pregnancy checking by ultrasound is used by 75% of respondents. Bull selection is based on purebred EPDs, physical appearance, and performance. 49% sourced breeding bulls from a purebred producer, 15% from a bull-test station, 11% from their own herd, 8% from auction and 6% from commercial producers.
Calf death
The average calf death loss was about 5.3% with 2.5% of calves born dead or that died within the first 24 hours and 2.8% from birth to weaning. There were four main causes of calf deaths – birthing complications (abortion, dystocia), scours, respiratory disease, and unknown causes. Health management for calves included navel dip (34%), selenium/vitamin E injection (92%), vitamin A/D injection (58%).
Weaning
The most common weaning method remains traditional separation (67%), with others using fenceline (23%), two-stage/nose paddle (2%) or natural (1%) weaning. Only 17% sold calves at weaning; while 33% did not sell any of the 2016 calf crop in the 2016 calendar year. Creep feeding, the practice of supplementing the dam’s milk with feed provided in pasture, appears to be a regular practice for the responding operations with 27% of participating operations using this practice.
Dehorning
The majority (85%) of respondents’ report using polled genetics – 33% dehorn shortly after birth, 50% at weaning. With 20% using dehorning paste followed by 17% using electric disbudder/wire, and 13% disbudder/scalpel. About 15% of respondents always use some form of pain mitigation when dehorning, while 15% sometimes use pain control.
Castration
The majority (64%) of respondent’s castrate calves shortly after birth, 29% at weaning, and 7% at other times. The vast majority (94%) use a rubber bands with 6% saying they always use pain control and 3% sometimes use pain control.
Other Practices
About 50% of producers body condition score their cows. 38% of respondents used only one breeding group; 31% used two, and 30% used three or more breeding groups. 75% provided salt and 87% provided mineral to cows and bulls year-round.
The majority (72%) reported they vaccinate their cows, and 94% vaccinate their calves. Similarly, 93% deworm their cows and 92% deworm their calves.
Over 43% test their feed for quality and 26% of those use the results to balance rations. The majority (>95%) provide water pumped to a trough and 17% had tested water quality within the past five years. In addition, 86% have completed soil sample results in the last five years.
In terms of innovation, 40% use an RFID reader. Record keeping systems were primarily paper (80%), Excel (24%), and smartphone/tablet (18%). In terms of programs 83% have an environmental farm plan, 67% have a preventative health program, 63% have read the Beef Code of Practice.
The full summary report is available at https://www.uqat.ca/beef-symposium-production/doc/northen-beef-study.pdf
- Atlantic Cow-Calf Survey 2016/17
-
Atlantic Cow-Calf Survey (ACC) 2016/17
The first ever, Atlantic Cow-Calf Survey was administered during the fall of 2017. There were 65 fully completed surveys which answered all 79 questions. Forty three percent of the responses were from New Brunswick, 31% from Nova Scotia, 26% from Prince Edward Island, and less than 1% from Newfoundland and Labrador. The majority of the primary decision makers were males between the age of 45 and 60 years. In total, 44% of respondents work off the farm full time. Breed composition of the cow herds indicated 65% were commercial, 29% purebred and 6% other.
Calving and Reproduction
On average there were 44 breeding females per operation with 61% of operations calving inside barns or covered sheds. Scour vaccination was administered to cows and heifers by 35% of operations participating in the survey. In total, 78% of cows and 79% of heifers calved in the first 42 days of calving. The average length of the breeding season for cows and heifers was 136 days, and average length of the calving season was 121 days. It was noted that some operations have year-long breeding and calving seasons. The recommended practise is a 63-day breeding period to allow females to recover after calving before the next breeding.
Calf death
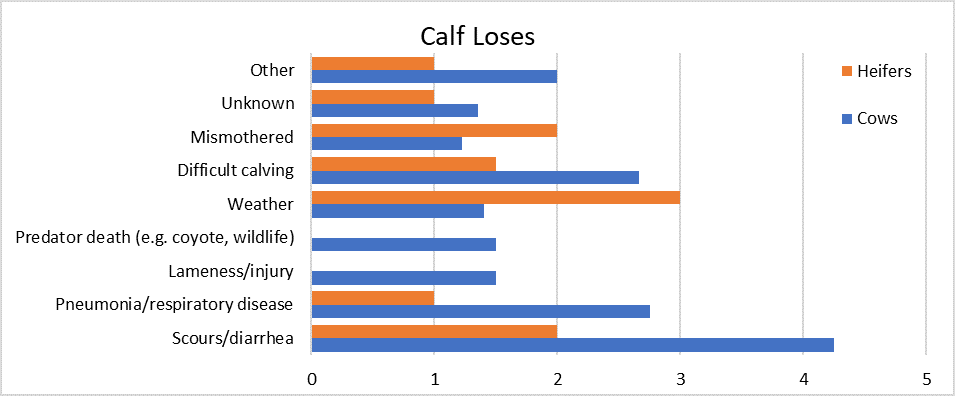
The calf birth weight from cows and heifers was on average 88 lbs. Common treatments after calving included castration using a rubber band, inserting a management tag as well as a selenium and vitamin E shot. Death loss at birth for cows was 6%. Calf losses were primarily due to scours/diarrhea for cows and weather for heifers.
Weaning
The average weaning weight for calves was 593 lbs. The most common weaning method was by traditional separation of cows and calves, however, 20% reported using two stage weaning. Traditional separation may be used by many operations due to the fact 42% of steer calves and 26% of heifer calves were sold at weaning. Of the heifer calves, 24% were kept as replacements. Approximately 25% of both the steers and heifers were backgrounded for 30-60 days prior to sale.
Dehorning
Over 60% of responses reported that 100% of their calves were born polled. The most common dehorning method was by using spoons, cutting or Barnes dehorner.
Bull Purchasing
Bull purchases were made primarily through another producer, followed by the annual bull sale at the Maritime Beef Test Station and purchase from outside the province. Bull purchases were based on breed, conformation, pedigree, Expected Progeny Differences (EPDs), and being polled. Bulls were culled for reproductive issues, physical soundness and age.
Pasture and Forage Management
One of the key strengths of beef production in the Atlantic region is the capacity to grow forage. Prior to weaning, 95% of respondents are using rotational grazing. At weaning, there is a shift towards continuous grazing. Of the 64 respondents, 75% did not test their feed quality and only 10% claimed to test feed on a regular basis. From the 26% total that did test their feed in 2016, 72% used the results to balance a ration.
On average, the respondents achieved 92 days on permanent pasture, 83 days on silage, 74 days on baled hay, 66 days on stock piled pasture, 52 days on crop residues and 33 days on grazing annuals. Just 22% of respondents were rejuvenating pastures every 1-5 years.
Health Management
The most commonly treated parasites included lice (84%) and internal worms (70%). Of the respondents, 73% typically vaccinate cattle and 45% vaccinate females pre-breeding. Over 80% claimed to inject in the neck region. From the 64 respondents, 97% are providing mineral to cattle. The most common method of mineral supplementation is free choice mineral. Mineral was provided at pasture turn out and at calving at 29% and 21% respectively.
For more Information:
The full aggregate results report from the survey is available on the Maritime Beef Council website at www.maritimebeef.ca .
- Alberta AgriSystems Living Lab: 2022 Baseline Adoption of Beneficial Management Practices
-
Alberta AgriSystems Living Lab: 2022 Baseline Adoption of Beneficial Management Practices

Conducted by Alberta AgriSystems Living Lab (AALL), a comprehensive benchmarking survey was distributed to 312 producers. Respondents represented three regions in Alberta and BC: South (Alberta only), Central (Alberta only) and North and Peace (Alberta and BC) regions. The survey aimed to capture a holistic view of BMP adoption and its regional variability, providing valuable insights into current practices and areas for improvement.
Hayland Rejuvenation
Rejuvenation of a forage stand, whether hay or pasture, involves using one or a combination of methods to increase productivity with a shift towards higher yielding forage species that provide improved nutritive value for livestock.
Using reseeding methods that minimize soil disturbance is an important consideration for optimizing the carbon sequestration benefits of haylands. Sod seeding was defined to survey participants as the direct drilling of seed into land where little or no seedbed preparation has been made. Most producers used direct/sod seeding (44.8%) and broadcasting (41.4%) to re-seed hayland areas.
Hayland Management
More than half (51.3%) of producers surveyed harvested hay when 10-50% of the stand was in bloom/headed out. This indicates a slight preference among producers for nutritional quality of harvested forage, meaning rejuvenation methods such as re-seeding and nutrient management are important considerations for overall land productivity and profitability.
Hayland Forage Species Composition
Producers were asked to rank the tame pasture species growing on their largest hayland area. The most abundant species was alfalfa, with 45.6% of respondents ranking it as first in abundance. Brome grasses and timothy were ranked as most abundant by 17.7% and 13.9% of producers, respectively.
Pastureland Management
For the survey, pasturelands were defined as grazing lands managed by the operation with either native or introduced (i.e., tame) forage species, which may or may not receive periodic management such as tillage, fertilization, mowing, weed control, and irrigation. There were 297 respondents associated with this section of the survey, with 85.9% reporting managed pasturelands in 2022. From these 259 respondents, 255 provided acreage data. The total acreage of reported grazed pasturelands managed in 2022 was 283,435 acres, which represented 54.1% of workable land from respondents who answered yes to managing pasturelands in 2022.
Among respondents with pastureland, 22.8% indicated that at least some land had been converted into tame pasture since 2018, with most acres (acres = 13,496) being converted from low productivity cropland, followed by land conversion from native grass converted into tame pasture (acres = 1,467).Tame pasture was also converted from low productivity cropland (acres = 13,496), eroded lands (acres = 382), and saline lands (acres = 237).
Pasture Rejuvenation
There were 292 respondents represented for this portion of the survey, with 254 reported managing pastureland on their operation in 2022. The pastureland area sod seeded among producers managing pastureland ranged from 1.7% to 100% of their total pastureland area Brome grasses (54.8%) and alfalfa (51.6%) were the most common forage varieties sod-seeded among producers in 2022.
Pasture Forage Species Composition
Respondents ranked the abundance of tame pasture species growing on their largest tame pasture area. Brome grasses were most abundant on the largest pasture areas, as reported by 47.2% of producers. Wheatgrasses, fescues, timothy, and alfalfa were also often ranked in the top five most abundant species.
Continuous Grazing
Most respondents (92.3%) continuously grazed their cows (with or without calves), almost half (47%) continuously grazed their replacement heifers in 2022, and a smaller proportion of producers continuously grazed yearling grassers and grass-finished beef cows.
Rotational Grazing
Of 208 survey respondents, 144 producers (69.2%) indicated that they used rotational grazing on approximately 57.1% (128,542 acres) of total pasture acres during the 2022 grazing season. Almost half of respondents (49.0%) indicated that pastures/paddocks were rested between 30 to 60 days before they were grazed again.
Respondents were asked the main reason for not adopting rotational grazing in 2022. Almost half of the producers (48.4%) reported lack of water availability as the main reason. Other reasons selected included the up-front investment (10.9%) and not wanting to use an electric or portable fence (9.4%).
Extended Grazing
Bale grazing was reported to have the longest length, commonly starting in November (55.3%) and completing in April (23.7%) and May (23.7%) with an average of 139 days (median of 149 days) in use. Swath grazing had the shortest frequency of use, with an average of 80 days (median of 51 days), commonly starting in October (38.5%) and ending in December (40%).
Feed Testing
Respondents were asked how often their feed was tested for quality and how often cattle rations were formulated with guidance from a nutritionist, software program, or other service provider over the past five years. Nearly half of all producers (45.4%) who managed beef cattle reported testing their cattle 75% 7% 2% 16% 0% 1 to 25% 76 to 99% 100% 50 feed every year. Over two-thirds of producers (37.8%) indicated feed formulation was guided by cattle nutritionists every year. A significant proportion of producers indicated they never used feed testing (25.4%) or feed formulation (35.7%), and less than 25% used these practices only once every several years or when a feed quality issue was suspected.
Ionophore Use
For beef cows, 20.7% of total respondents used ionophores in their diets (sometimes or always), where these producers owned/managed 45.7% of total beef cows. For producers with first calf heifers, 23.9% used ionophores in diets (sometimes or always), where these producers owned/managed 47.5% of first calf heifers. Of producers with backgrounding cattle, 33.8% used ionophores in diets (sometimes or always), where these producers owned/managed 79.3% of all backgrounding cattle. For finishing cattle, 36.1% of these producers used ionophores in diets, where they owned/managed 99.5% of all finishing cattle represented in the survey.
Implant Use
Among producers with beef cows did not implant their calves before weaning, 14.0% indicated that all calves were implanted before weaning, 9.9% implanted some calves before weaning and the remaining 5.3% did not know the implant status.
Among respondents with backgrounded cattle, 33.9% reported that implants were used in 2022, with these producer owning/managing 84.5% of backgrounded cattle represented in the survey. 37.2% of producers with finishing cattle used implants, representing 99.6% of the total finished cattle represented in the survey.
Cattle Grazing on Cropland
From 109 respondents from all regions, 22% reported cattle grazing crops. The South region had the highest rate of adoption with 28.6%, and North and Peace region had the lowest rate of adoption with 8.7%. Respondents were also asked if the cattle grazing the cropland belonged to the operations and all but one operator said yes.
Read the full report:
Feedback
Feedback and questions on the content of this page are welcome. Please e-mail us at info@beefresearch.ca
This content was last reviewed December 2024.
